
Game Over: A Behind the Scenes Look at Tackling Participant Fraud in the LEVEL UP! Video Gaming Survey – by Ashley Brooks
I vividly remember when I first became concerned about fraudulent participants in INQYR’s LEVEL UP! video gaming survey. At the height of our intense international participant recruitment efforts, checking our survey responses was a daily ritual. After a strong opening salvo in our recruitment for the first three months, we began to experience a lull and were wracking our brains for ways to boost numbers, including offering greater financial incentives in the prize draw.
And then one day, we received almost 60 responses!
I was skeptical. At that point, 4-5 responses a day were the norm, and our recruitment activities at the time couldn’t account for this spike. Closer inspection of the data all but confirmed my suspicions: these responses are fraudulent.
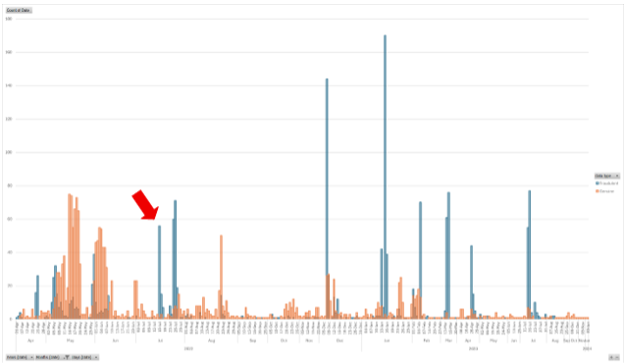
Pictured above: A histogram showing the genuine (orange) and fraudulent (blue) LEVEL UP! responses collected between April 2022 and January 2024. The red arrow points to an unexpected spike in responses in July 2022.
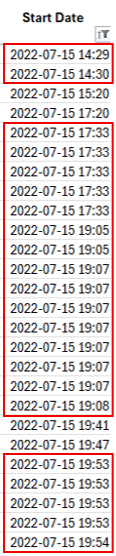
The first obvious tell was in the timestamps—we were being bombarded with responses initiated within 1-minute of each other.
Pictured right: Response initiation timestamps. Responses initiated in consecutive or concurrent minutes are highlighted in a red outline
The second obvious giveaway were the duplicate and irrelevant qualitative answers.

Pictured above: Duplicate irrelevant qualitative answers (though we approve of the bots’ self-love!).
I broke the news of the fraud at my next weekly study check-in and expressed my confidence in devising a way to deal with these responses, and recruitment continued as normal.
Difficulty Spike
The more I thought about the problem, however, the more complicated it became because:
It is impossible to infer accuracy: I had no prior knowledge of the true distribution of genuine and fraudulent responses. Because I would have no ‘correct’ answer to compare my work against, it would be impossible to measure the accuracy of my exclusion procedure. We were extremely wary of the risk of publishing misinformation about our communities, so it was important that we analyzed the correct data. In the absence of accuracy, I could instead aim for confidence in my exclusions by rigorously and exhaustively checking the data in multiple ways.
But…What about false positives?: Even though it’s impossible to calculate the accuracy of the exclusion process, the risk of unintentionally excluding genuine participants (i.e., a false positive) remains. The risk of false positives could also increase the more rigorously you screen the data. It’s also quite typical for participants to not provide ‘perfect’ data and this should not unduly be grounds for exclusion. For example, given the international scope of the survey, I was particularly mindful of the risk of mischaracterizing normal variations in written English language ability in the qualitative answers as ‘suspicious’. Response initiation time also ran the risk of excluding participants by mere coincidence.
And…Which checks do I perform?: The risk of a single fraud check mischaracterizing a participant as fraudulent could be reduced by looking for some kind of ‘agreement’ across multiple fraud checks. Though I had some ideas about what these checks could be, each additional check requires additional work and some—like checking qualitative answers—would be particularly time consuming, so scalability was an important consideration. I also expected some checks to be less useful. For example, checking IP addresses to detect fraud had become less effective throughout the 2010s as routing your web traffic through a VPN became increasingly popular.
Playing in the Sandbox
While I didn’t yet have a solution to all these problems, I did have some ideas that I wanted to try.
Coincidentally, we had wanted to apply for a grant to analyze video game screenshots collected in the survey, and so we needed to clean these data pronto. My hunch was that very few fraudulent participants would have uploaded a screenshot because file uploads are an unusual question type in surveys and so fraudulent participants—and particularly automated survey bots—would likely skip this question.
This seemed like a low-risk opportunity to test out some checks and a coding process with the help of three fantastic graduate students visiting from the UK supported through the Turing Scheme: Chase, Sheona, and Emily. Together, they double coded over 1,400 responses as either passing or failing 8 checks:
Response initiated within 1 minute of another
Nonsense qualitative answers
Mismatch between reported country of residence and IP address geolocation
Mismatch between reported country of residence and latitude and longitude coordinates
Duplicate qualitative answers
Response times more than 3 standard deviations above or below the median
Mismatch between reported age and year of birth
Suspicious email address

Pictured above: An Excel spreadsheet of eight fraud checks scored either as 0 (pass) or 1 (fail).
I’m hugely appreciative to these three for sticking with this painstaking, fatiguing, and—let’s not mince words—tedious work. I learned a lot from this initial coding process that led to later refinements:
All coder pairs had high levels of agreement across all coding categories (86-100%), with most of this agreement attributed to both coders rating the response as a ‘pass’.
Even coding categories with objectively correct answers showed disagreement between coders so coder error is an important factor to consider.
It was particularly slow and fatiguing coding the qualitative responses.
Suspicious email addresses had the lowest levels of agreement across all coder pairs, so it was hard to agree on a subjective criterion of ‘suspiciousness’ for this. We dropped this check in future testing.
There were very few responses with extremely fast or slow response times, so we would need to determine a different benchmark for measuring suspicious completion time.
There were very few suspicious features in this subsample, seeming to confirm my prediction that the screenshot question would be mostly skipped by fraudulent participants.
Given this, we excluded participants that failed 3 or more of the fraud checks and I re-inspected responses failing 2 checks to make case-by-case exclusion decisions, ultimately excluding about 10% of the responses. We later found a small number of suspicious stragglers (< 10) as we got into analyzing the screenshot data later that summer, which we excluded, but the coding process seemed to mostly work well here.
Cleaning the rest of the sample required a bit more problem solving. Many responses had no qualitative answers, so we couldn’t rely on one of our best fraud checks. We also needed a more scalable process because we had over 2,000 more responses left to check.
Challenger Approaching: Cluster Analysis
Cluster analysis is a method used to group things—like survey responses—based on how similar they are to one another across multiple characteristics. Imagine sorting laundry not just by color, but also by fabric type, washing temperature, and whether something is delicate. Cluster analysis will find groupings in the laundry pile based on the patterns it detects across all these indicators. Based on these groupings, you might then consider laundering these items separately.
In our case, we’re cleaning 3,681 survey responses based on 10 checks—this time aided by two other research assistants, Zoe and Renan:
No qualitative answers
Nonsense qualitative answers
Duplicate qualitative answers
Mismatch between reported age and year of birth
Extreme number of hours spent gaming per week (> 80 hours)
Mismatch between reported country of residence and IP address geolocation
Blacklisted IP address
Duplicate IP addresses
Fast response completion (< 10 minutes)
Response initiated within 1 minute of another
One helpful feature of cluster analysis was that it flexibly allowed me to explore different combinations of fraud checks. As we found in the pilot testing, ‘extreme’ completion times were not very useful for catching potential fraud. This time, I tested different completion times (i.e., < 5, < 10, or < 15 minutes) to see which clustering was easiest to interpret; < 10 minutes worked the best.
My hope was that this process would let the data speak for itself and give us a way to make confident evidence-based data exclusions. The first thing the analysis told us was that there were three clusters of response in the data, illustrated in a satisfying diagram called a dendrogram that shows how similar responses were clustered together in increasingly large groups.

Pictured above: A dendrogram showing 3 distinct clusters of responses.
Zooming in on the fraud characteristics of each cluster, some helpful differences emerge.

Pictured above: Number of responses failing each fraud check in each cluster.
The first cluster is most notable for having many responses with no qualitative answers and response times of less than 10 minutes that were initiated within 1-minute of another response. This could indicate fraud, but a lack of qualitative answers alone should not be disqualifying.
The second cluster has relatively few failing fraud checks that discern it from the other clusters, except for the duplicate qualitative answer check. Remember the issue of measurement error that came up in the pilot testing? This duplication occurred because one qualitative question we coded ended up eliciting mostly closed answers, rather than the duplicate nonsense “I feel so handsome” answers I recognized as fraudulent. IP blacklisting was also relatively high in this cluster, but no more so than the other clusters.
The third cluster is a doozy: similarly high rates of poor and duplicate qualitative answers accompanied high rates of response within 1-minute of another response. Responses in this cluster failed the most checks on average.
With this information, I was able to home in on the most informative combinations of failed fraud checks and make evidence-based exclusion decisions. We kept all the responses from cluster 2 and our final exclusion criteria removed any responses from clusters 1 & 3—mostly the latter—that failed the ‘poor qualitative answer’ check or any combination of two or more other checks.
Final Score: Genuine responses 2,074 – Fraudulent responses 1,607
By the end of this cleaning process, I had determined that almost 44% of the responses were fraudulent. As a reminder, accuracy is off the table because we don’t have a correct answer to compare this to; my goal is confidence. So, to sprinkle a bit more confidence on top of this rigorous cleaning process, I took a closer look at the characteristics of or ‘genuine’ and ‘fraudulent’ participants and found several interesting things.
Firstly, the fraudulent participants presented as relatively normative. By comparison, the genuine participants more often richly and variously described their gender and sexual identities in the ‘other’ free text box (not included in our qualitative answer coding), reported higher levels of neurodiversity, and were also more equally distributed across INQYR’s five study regions.

Pictured above: Some demographic characteristics of the fraudulent participants.
Two other interesting findings also enhance my confidence in this cleaning process. As I recounted at the beginning of this blog post, I raised the alarm about participant fraud about four months into data collection. Interestingly, almost 90% of the retained genuine responses were submitted within those four months—yet we didn’t use submission date in our screening criteria.
Calling back to our pilot testing, another reassuring finding was that over 60% of the retained genuine respondents submitted a screenshot, whereas only about 9% of the fraudulent respondents did so. Once again, we did not code a lack of screenshot submission as ‘suspicious’ because there could be perfectly legitimate reasons for this (e.g., not having any screenshots to share).
Altogether, I now feel reassured and confident in the integrity of the LEVEL UP! dataset but we are not the only researchers who were caught off guard by rampant participant fraud. The massive shift to online research during COVID exposed huge vulnerabilities in survey research (e.g., anonymity, declining performance of CAPTCHAs, VPN use) that were grossly exploited, with hugely damaging consequences; other researchers have lost thousands of dollars in misappropriated participant incentives and have had papers retracted because of participant fraud. My hope is that this procedure offers a flexible exploratory approach that could help researchers remedy affected datasets—and particularly the numerous other studies on LGBTQ+ populations I read about that were impacted by fraud.
You can read the pre-print describing this study in full below
Button link: https://doi.org/10.31235/osf.io/za8v6_v1
Post-Credits
I enjoy a final twist in the tale, so I want to close with a brief critical reflection.
While preparing the data for coding, I noticed a small number of responses submitted from IP addresses in Ukraine, Russia, Palestine, Nigeria, and other countries where people are living through immense hardship, trauma, and persecution. I further suspect that many of the fraudulent “USA” responses were, in fact, not from the USA at all and instead originated from developing and emerging economies. Indeed, COVID not only impacted how we do research, but it also compounded existing global economic and health inequities.
So, while many of the fraudulent responses were probably bots, the factors motivating fraudulent participation are nonetheless deeply human and worthy of compassion.
Cleaning the data was hard, but the real work we have to do is much harder.